We have collected performance results for HPGMG-FV running on the following machines
-
K Computer (Fujitsu, at RIKEN). Each node of the K Computer has an 8-core SPARC64 VIIIfx running at 2.0 GHz, for a peak of 128 GF/s and 64 GB/s theoretical bandwidth. The network is a 6D torus.
-
Mira (IBM Blue Gene/Q at ALCF). Each node of Mira has 16 cores with 4 hardware threads per core, for a peak of 204.8 GF/s and 29.3 GB/s STREAM bandwidth (6.99 F/B). Mira's network is a private 5D torus for each job.
-
Edison (Cray XC-30 at NERSC). Each node of Edison has 2 sockets containing 12-core E5-2695v2, for a peak of 460.8 GF/s and 89 GB/s STREAM bandwidth (5.18 F/B). Edison uses the Cray Aries network, a high-radix dragonfly network.
-
Peregrine (NREL). Peregrine has the same node architecture as Edison, but uses an Infiniband network.
-
Hopper (Cray XE-6 at NERSC). Each node of Hopper has 2 sockets containing 12-core AMD "Magny Cours", for a peak of 201.6 GF/s and 50 GB/s STREAM bandwidth (4.03 F/B) Hopper's network is Cray Gemini, a shared 3D torus.
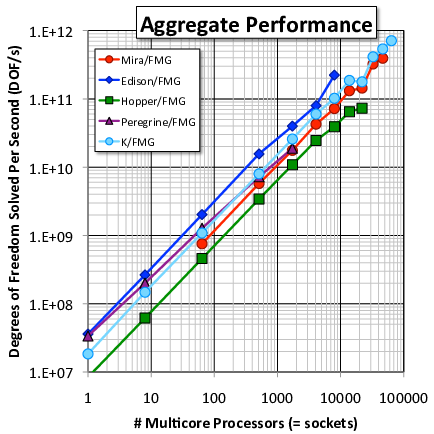
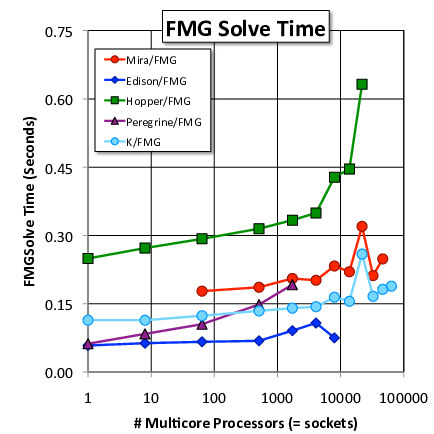
All runs have been with $128^3$ cells per socket, a problem size that approximately strikes a balance between depending on network and latency versus throughput. While all machines see performance degradation during weak scaling, it is much more gradual for the faster networks (e.g., compare Peregrine to Edison).
Update 2014-06-09
The x axis on the plots above count NUMA nodes (one per socket, except on Hopper which has two NUMA nodes per socket). It is an arbitrary measure and many other normalizations exist (e.g., number of sockets, cores, threads, or vector lanes; power consumption or machine acquisition cost). Slope and maximum value (on the DOF/s plot) are more meaningful quantities for comparing machine performance (but see also dynamic range).